


While MRR, NRR, total annual revenue, and year-over-year growth are important to drive business decisions, you're only scratching the surface of what your data can do.
Nick Saunders kindly agreed to chat with us for this article,
Too often, sales metrics or sales KPIs focus on lagging indicators like revenue creation, number of meetings, etc.
In today's digital economy driven by digitally-competent buyers, sellers need to measure their ability to drive decisions which ultimately leads to revenue creation.Nick Saunders, Director of Enablement at Mimecast


And I couldn't agree more.
It's why I don't want to rehash the same tired sales metrics you've heard before.
Instead, I want this post to challenge you.
To inspire you to ask the right questions that drive the right actions and avoid getting caught up in data silos, causing you to lose focus on your core business objectives.
What are sales metrics?
Sales metrics measure the sales-related performance of your team, company, or individual sales reps over a period of time.
These insights help you become a data-driven sales team by monitoring sales goals and empowering you to tweak your strategy to stay on track.
There's just one problem.
You need to define what sales metrics matter to your team. A successful organization doesn't make waves by blindly tracking data on autopilot or following what everyone else is doing.
Instead, the leaders who run a successful team, have figured out which metrics will keep everyone accountable, motivated, and goal-orientated.
That means going beyond revenue-focused and lagging sales metrics.
7 types of sales metrics you're probably not tracking
To help you refine your sales strategies, we've identified 7 sales metrics you should consider tracking.
Whether you're a new captain or have a couple of years' experience navigating the SaaS seas, these metrics can help you find and fix leakages in your pipeline.
1. Product engagement: understanding user interaction
Product engagement measures how frequently and deeply users interact with your product. We’re not just talking about major events indicating a customer’s churn risk or readiness to upsell.
There is so much subtle activity that often flies under the radar. Of course, you can spend much of your workweek investigating said signals or pay a data scientist a lot of money to do it for you.
Breyta tracks and ranks said commitment levels by analyzing user actions, from simple logins to complex feature usage. This clearly shows how integral your product is to their daily routines.
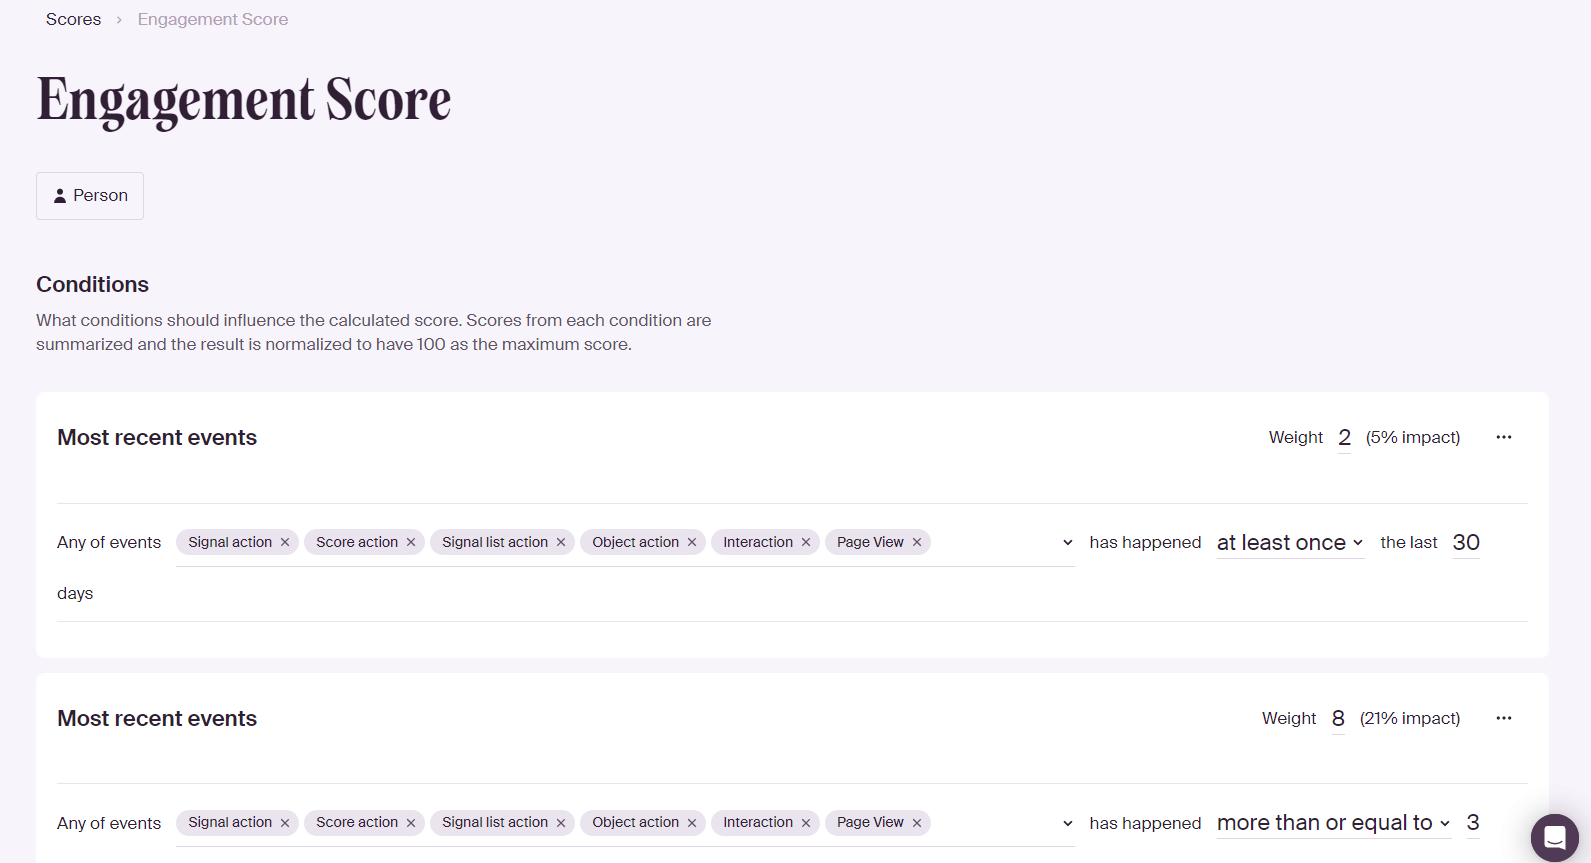
This Engagement Score also underpins your Health Score, measuring a single user or company's vitality.
We’re not too prescriptive on what you deem a loyalty factor, and you can build your tailored Engagement Score accordingly.
Simply make a string of telling events, add appropriate weighting to each, and get notified when someone’s ready to upgrade or at risk of churning.
2. Customer fit: identifying your target audience
Building on our last point, we have customer fit, which breathes life into your ICP. After all, you don’t want to waste your time engaging customers who don’t fall under your preferred clientele definition.
Our Customer Fit Score helps you understand whether users match your ICP based on the most critical fields.
Firmographic attributes
- Company name: Essential for identification and personalization.
- Industry: Key for segmenting and targeting relevant markets.
- Number of employees: Indicates company size, useful for scaling and service offerings.
- Estimated revenue (MUSD): Reflects financial capacity and market positioning.
- Founded year: Offers insight into company maturity and potential growth stages.
Environmental attributes
- Lead source: Important for tracking marketing effectiveness and customer acquisition channels.
- HubSpot company lifecycle stage: Provides context on the company's evolution and readiness for specific solutions.
Behavioral attributes
- Active seats: Shows product adoption and usage intensity.
- Customer journeys: Indicates how customers interact with the product/service, revealing engagement patterns.
- Integrations added: Reflects the company's commitment to using the product and its integration within their tech stack.
- Scores setup: Demonstrates engagement with product analytics, indicating a data-driven approach.
Breyta aids in this by filtering through user data to highlight those whose behavior and interactions align closely with your defined ideal customer criteria and product-qualified lead definition.
3. Buying intent: gauging purchase likelihood
Likelihood to buy scores take the guesswork out of selling and upselling. This dynamic metric guides your outreach, enabling you to connect with prospects exactly when they're ripe for the conversation.
Let's look at two typical use cases.
Spotting the buying signals
Imagine the buzz when a new user joins—a hint that a prospect might be warming up to you. The trick? Pinning down that golden moment for outreach.
As the initial excitement simmers, it's your cue to decide: is it after the buzz of the third addition or the confidence-inspiring fifth instance? Timing is everything; getting it right means keeping your message relevant and resonant.
Mastering the art of timing with multiple clues
Granted, you generally want to weave together a few events. The art lies in balancing these signals, tweaking their importance while keeping an eye on the clock.
This fine-tuning process polishes your score to a sheen that reflects true purchase intent, steering you towards making your move at the most impactful juncture.
4. Churn risk: predicting customer retention challenges
The problem with reaching out to a doubtful or inactive customer is that it’s sometimes a case of too little, too late. Many CSMs will pore over user data across a few systems and try to piece it all together in their CRM data.
By the time they realize someone’s on their way out, they’re desperately clutching at their collar.
You don’t need to monitor churn risk obsessively, but it helps to get notified when a customer is packing their bags.
That’s where Breyta’s Signals come in, and you can set the equation for what you deem to be a worrying decrease in usage.
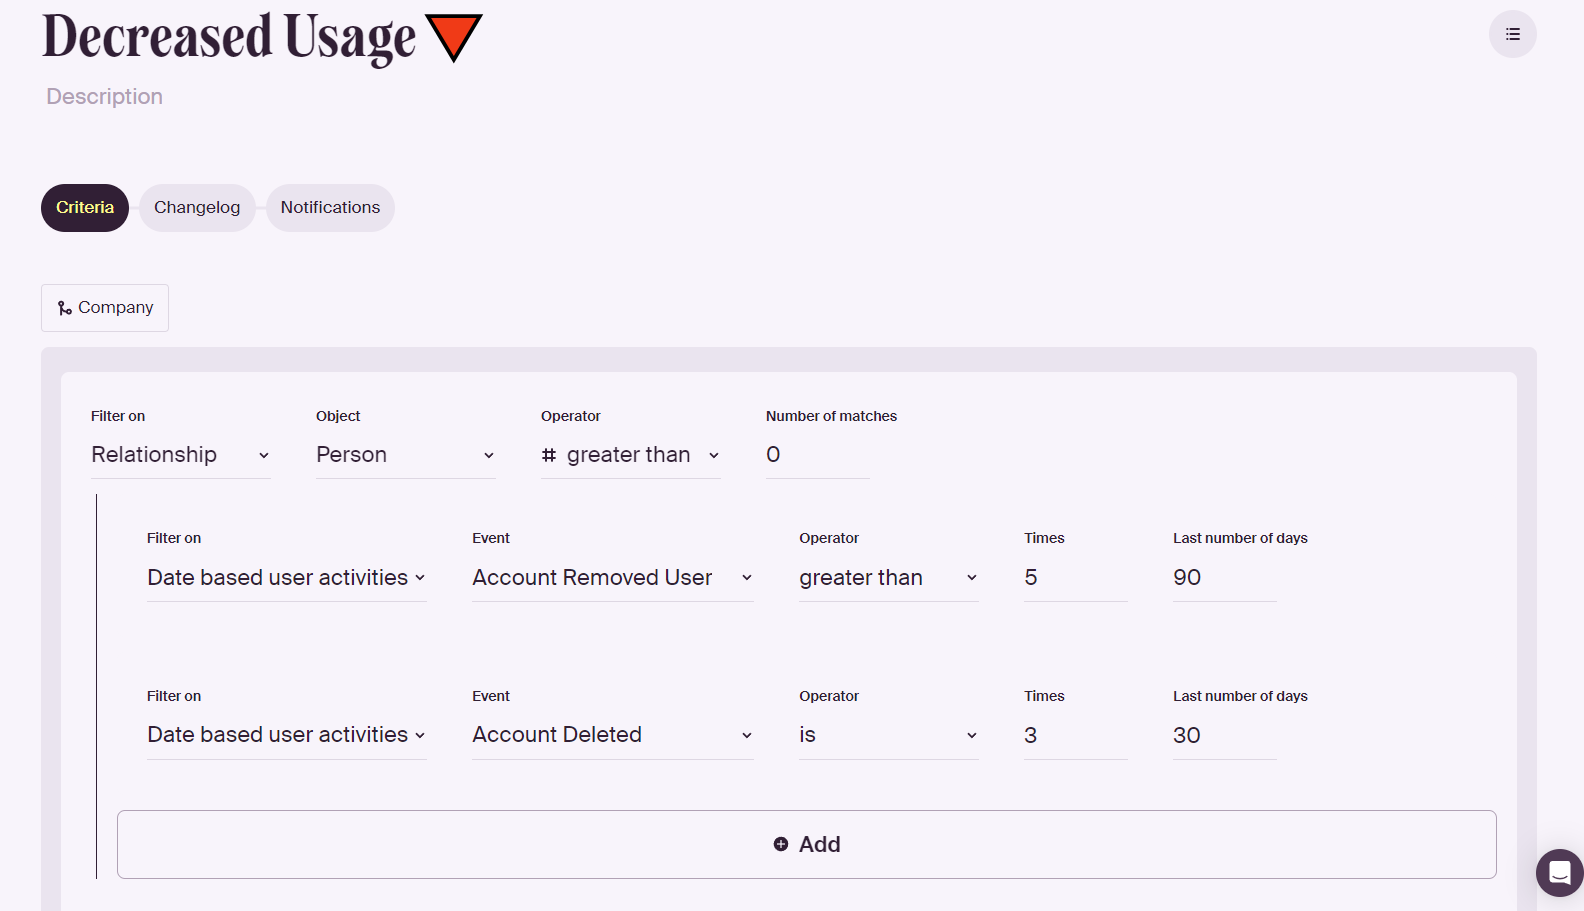
Simply establish which behaviors generally lead to churn, how many times they need to occur, and in what space of time. You’ll get alerted via your preferred comms channel whenever someone’s having second thoughts.
5. Revenue: tracking financial performance
Understanding estimated revenue is akin to having a strategic lens through which you can view and appreciate the unique value each customer brings to your business.
It's a critical tool in your customer success toolkit, empowering you to tailor your approach precisely.
Let's explore estimated revenue's pivotal role in shaping customer success strategies:
- Strategic customer prioritization: Like a skilled captain navigating the vast ocean, you can use estimated revenue to steer your attention toward the customers most vital to your company's financial health.
- Tailored success plans: With knowledge about a customer's revenue potential, you're better positioned to create success plans that resonate with their specific business scale and needs.
- Proactive risk management: By keeping a pulse on estimated revenue, you become adept at identifying early warning signs of potential churn.
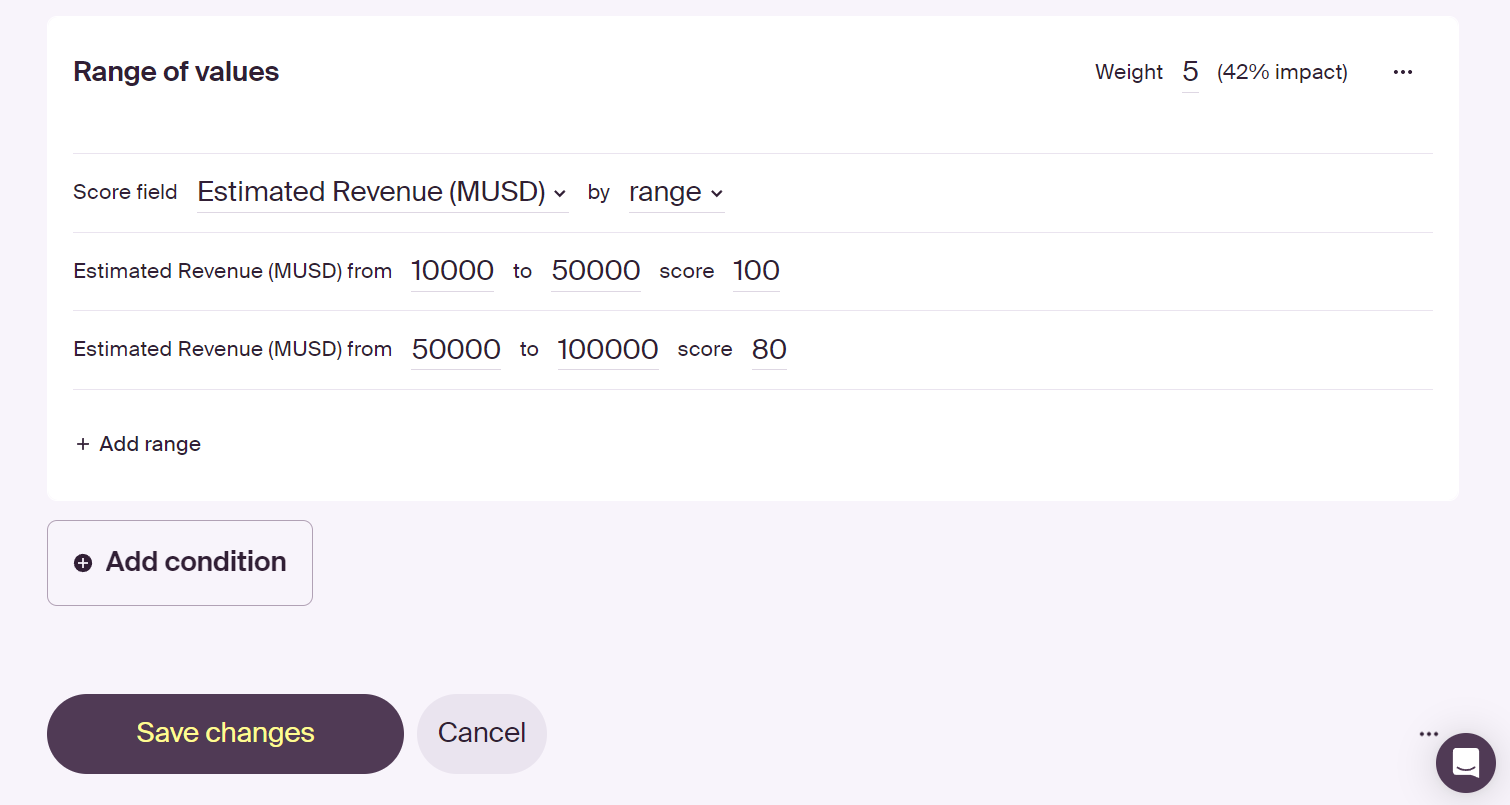
Breyta lets you add estimated revenue as part of your customer fit score. Add a condition to your fit score, set the score field to “Estimated Revenue”, and then rank your estimated revenue ranges.
Don’t forget to set the weighting of this range based on how much of an impact you want estimated revenue to have on your overall fit score.
6. Recent events: staying updated with user actions
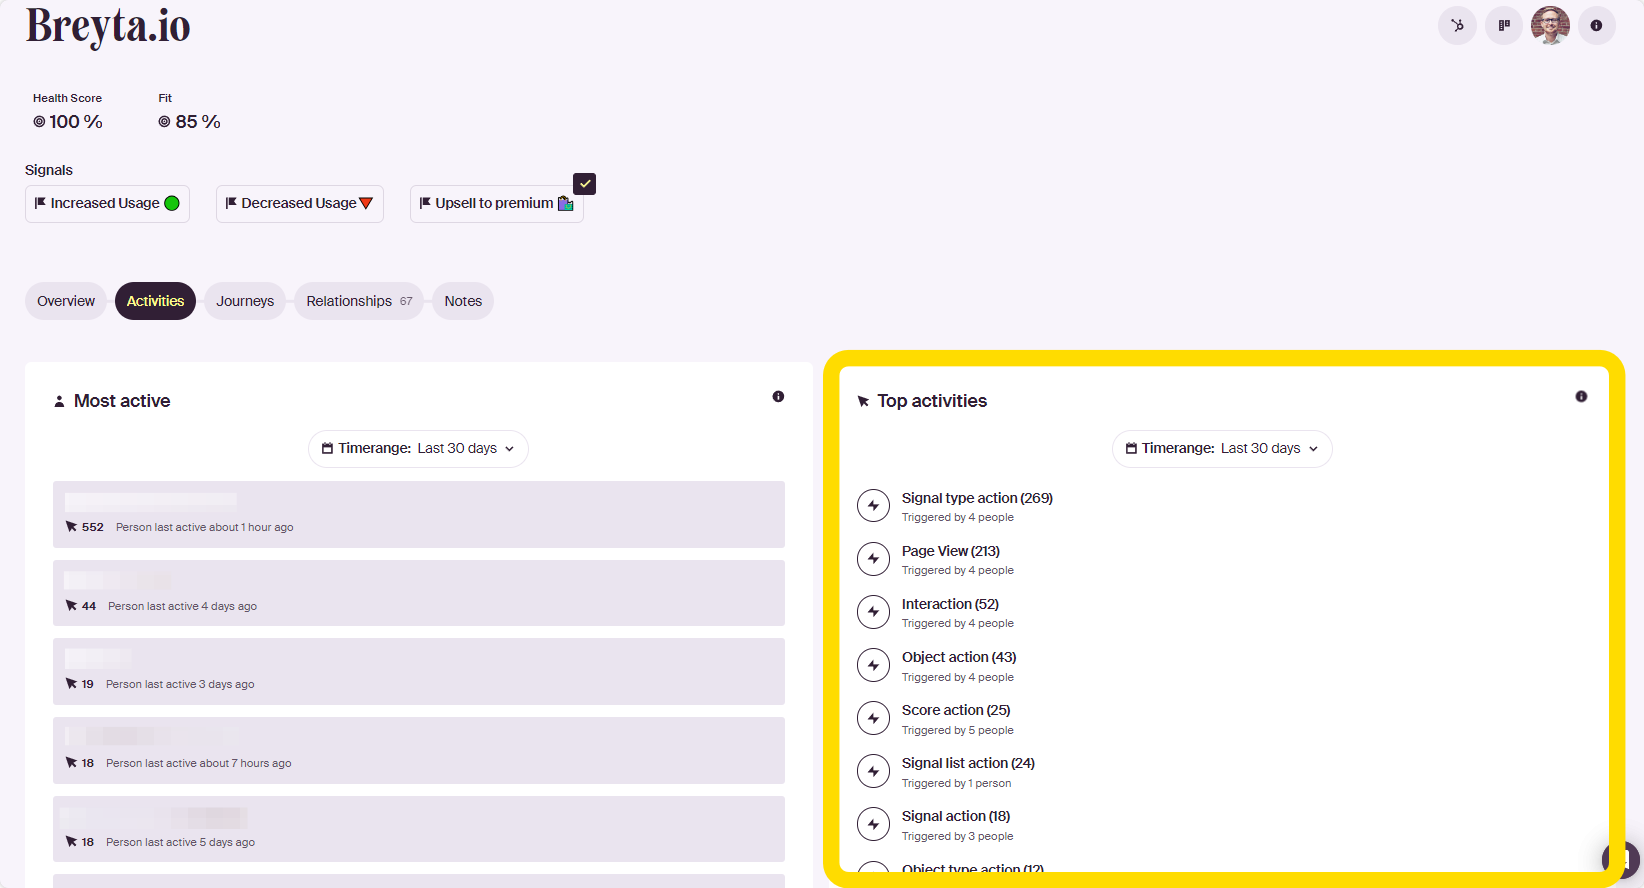
Recent events track user actions within a specified timeframe to gauge current engagement.
Breyta monitors these activities, providing insights into user behavior trends and helping you understand how recent changes or updates affect user interaction.
Breyta lets you track all your major user behavior milestones, fed by your integrations. A sample activity flow, for a customer called Sam, might look like this:
- Sam received a promotional email, registered by HubSpot.
- Sam then engaged with an onboarding email, sent through by Breyta.
- They logged into your platform, as provided by Segment.
- Segment later reflected that Sam invited six of their teammates to join.
- The next day, Sam decided your platform was worth a Pro plan upgrade, identified by Stripe.
7. GEM (Growth Efficiency Metric)
"Sales productivity or sales efficiency will become a lot more important in SaaS in the coming months and years," says Chris Blomberg.
Sales productivity or sales efficiency will become a lot more important in SaaS in the coming months and years.
As funding becomes increasingly hard to obtain, startups and scale-ups can no longer afford to just spend their way out of slow growth. They have to grow efficiently.Christian Sjøvold Blomberg, B2B SaaS Go-to-Market Advisor and Board Member


The best way to do this?
With the GEM score.
The Growth Efficency Metric directly links your expansion revenue and operating margin by analyzing your sales performance and keeping your team on track.
Christian Blomberg uses Lative (the inventors of GEM) to track sales efficiency in his teams. The Lative algorithm processes the closed-won business data from Salesforce and gives him insights he needs to make sure his team has efficient sales capacity to meet sales targets.
Create a winning team with the right mix of sales pipeline metrics
Customer satisfaction should always be your north star despite the focus on "sales" with sales metrics.
As Daniel Disney, founder of The Daily Sales, explains, "Focusing on the sale can sometimes lead salespeople to only push for a quick sale. By focusing on the customer experience, you increase the chance of winning long-term customers over short-term deals."
In Nick Saunders’ words, "A revenue target is an internal sales performance metric that means nothing to the customer. Focusing on helping the buyer make decisions and creating consensus in their own business is a customer-centric metric that matters."
Whatever metrics you choose to track on your sales dashboard, make sure it benefits the customer. When your buyers are happy your sales and CS pipeline becomes easier to manage, creating more flow in your business and helping you reach your strategic goals.